Search the Site
US Markets - Growth - February 15, 2018
US Markets Update
Volume 2, Issue 3
February 15, 2018
Download PDF Version here
Items of Interest:
- The S&P 500 Growth ETF (IVW) has declined 8% from when we last wrote about it in our January 29th report where we highlighted the very extended nature of the index from its long-term average and where one should consider trimming extended names.
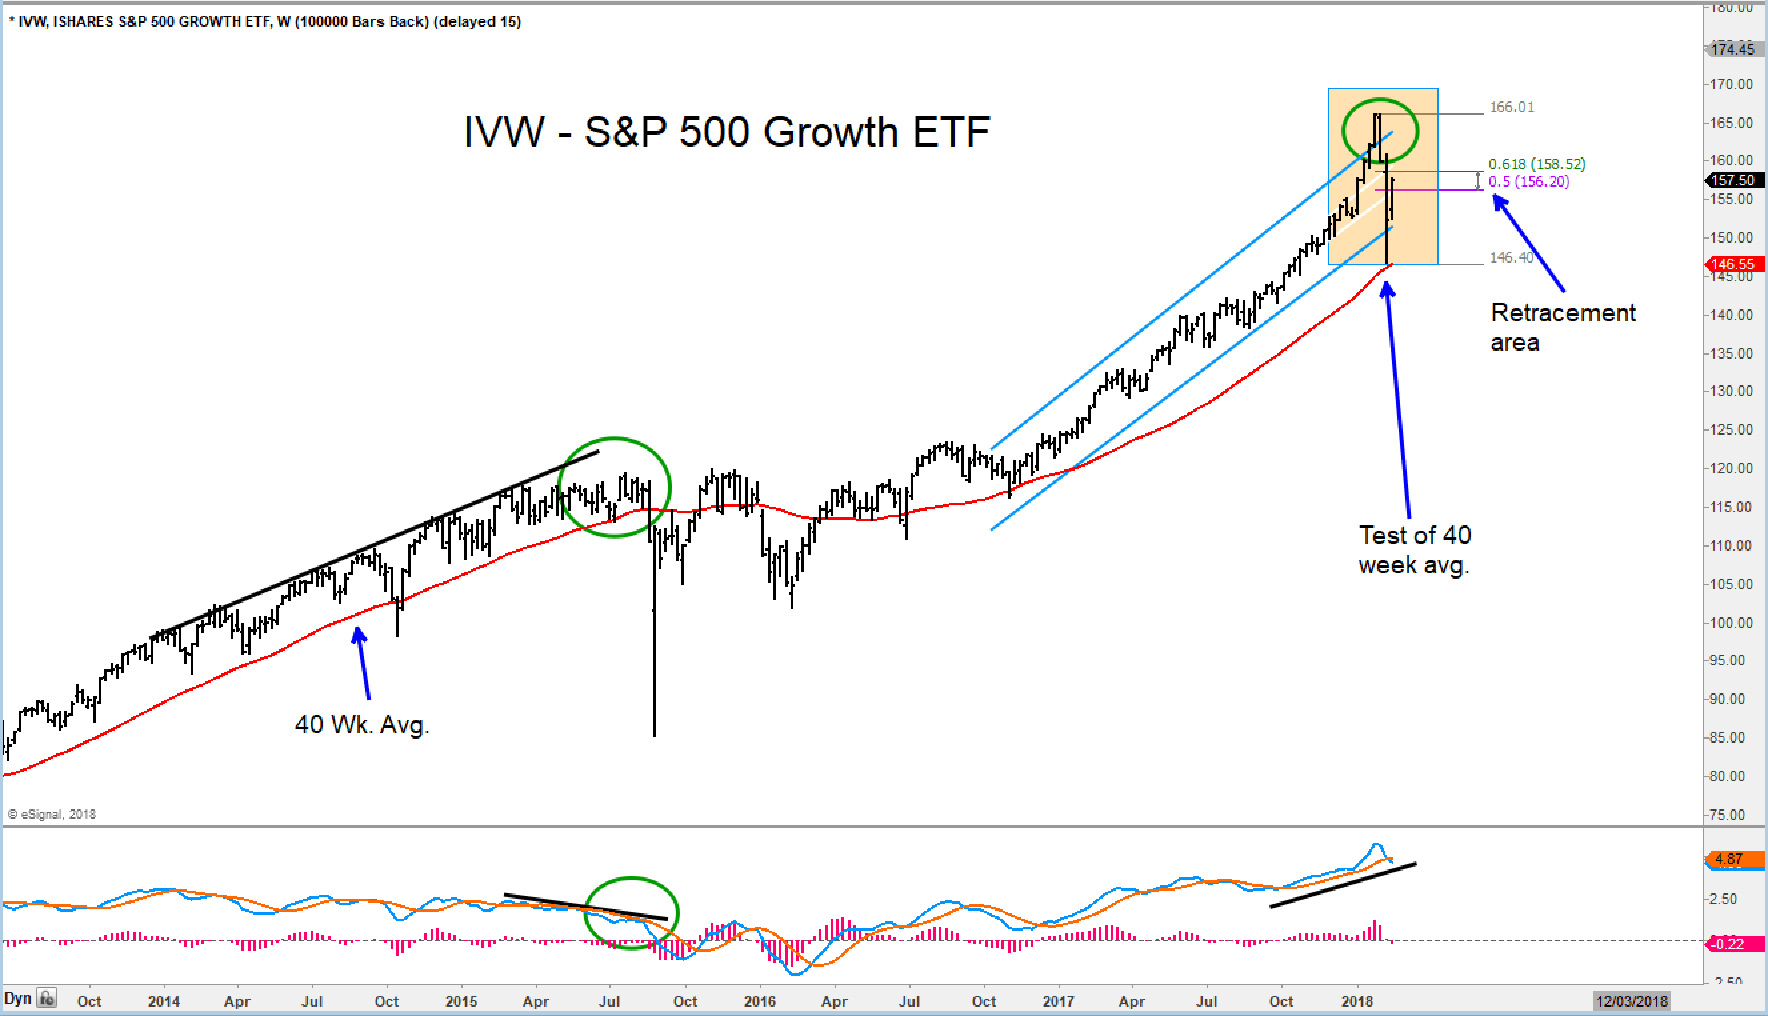
- With the intra-week low bouncing off the 40-week average, the IVW has recovered the lower regression channel and is in the retracement zone of 50% to 61.8% from where we often see a pullback starting from.
- We believe there needs to be more of a back and fill before we go much higher and would look at the $156—$158.50 area for signs of a stall.
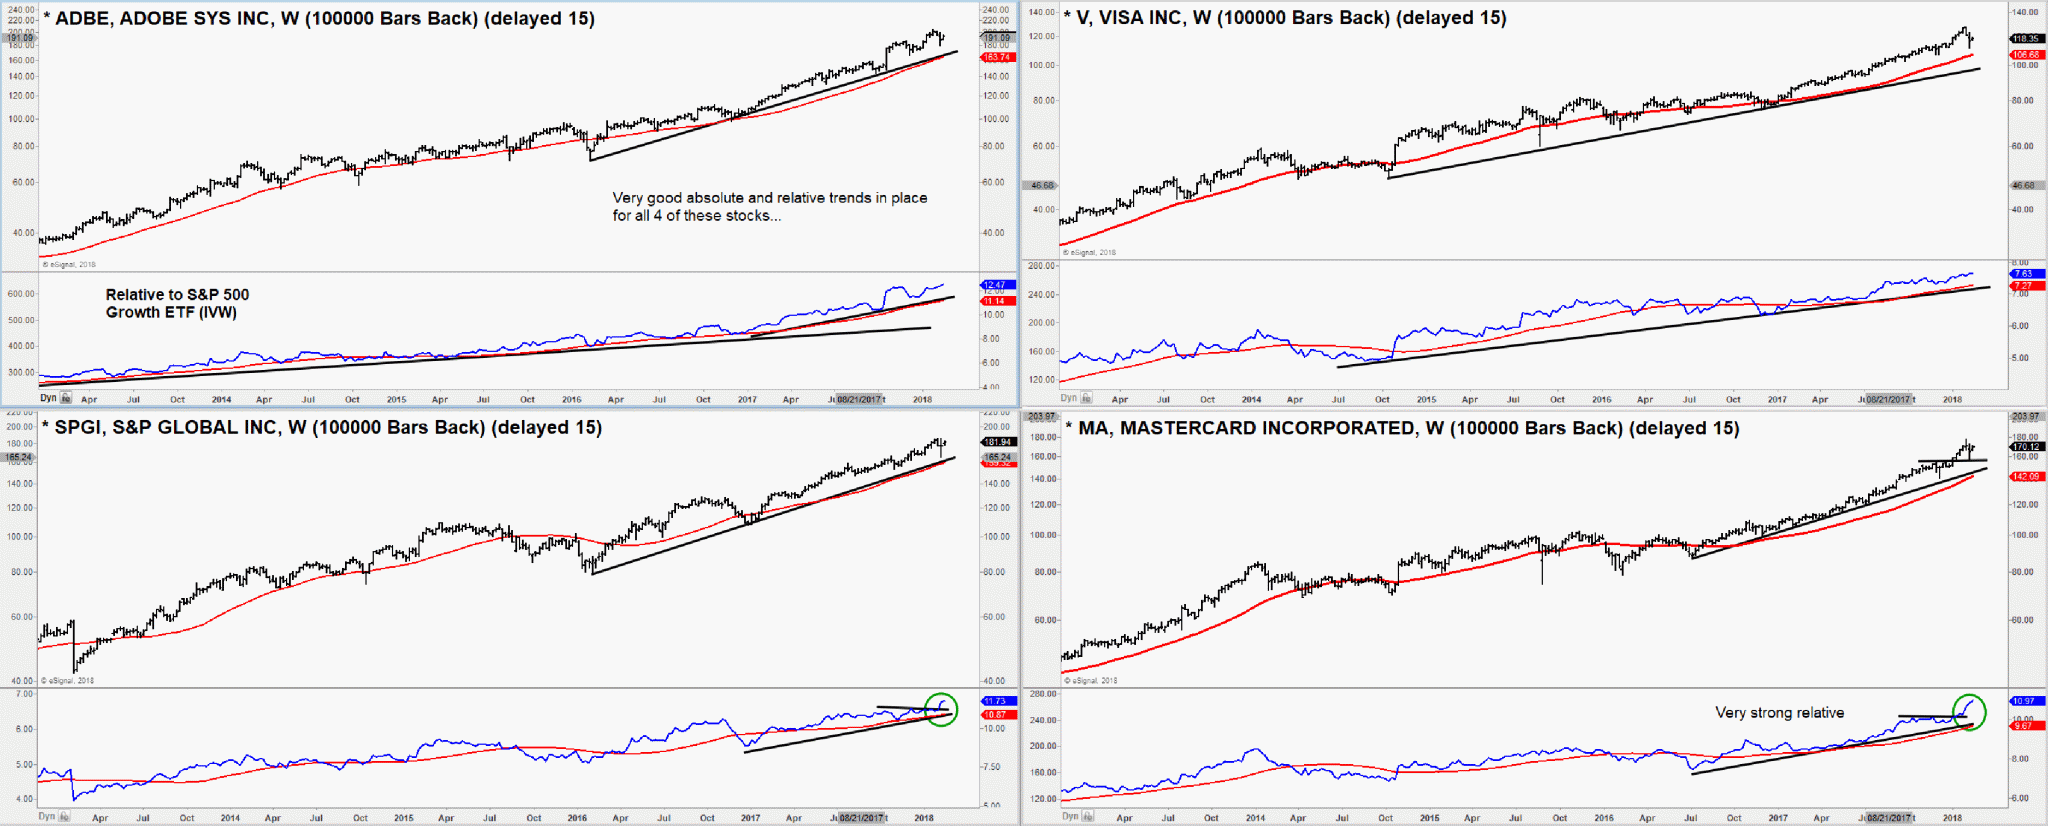
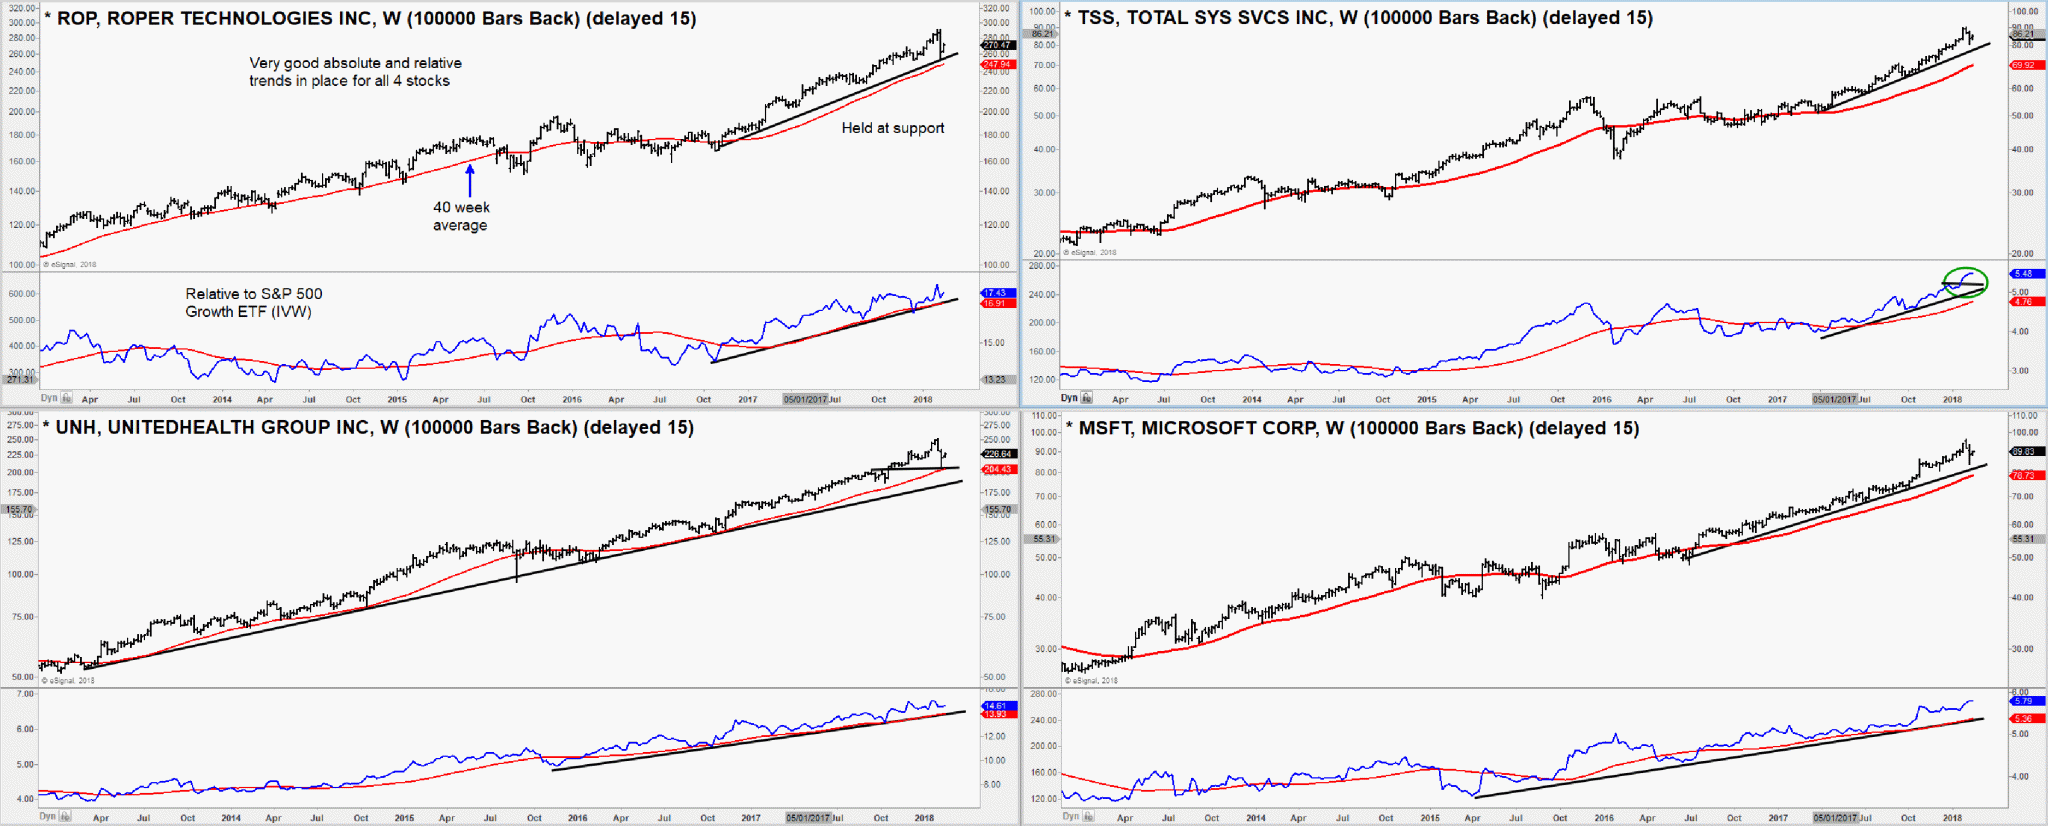
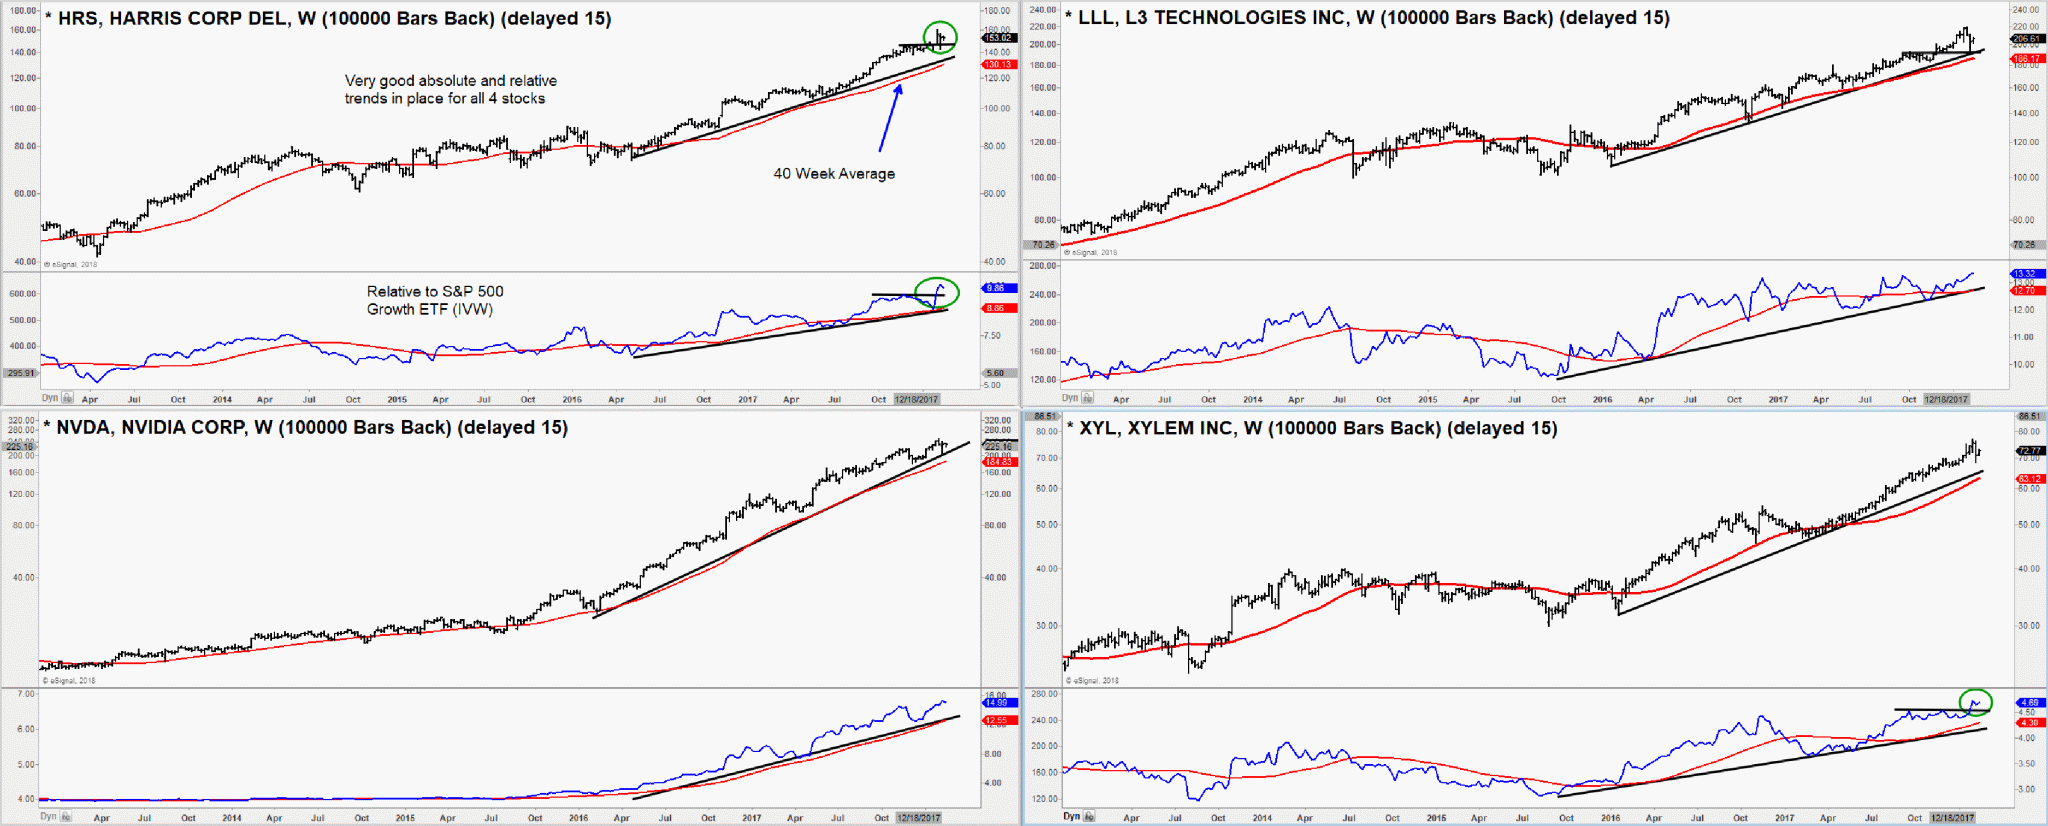
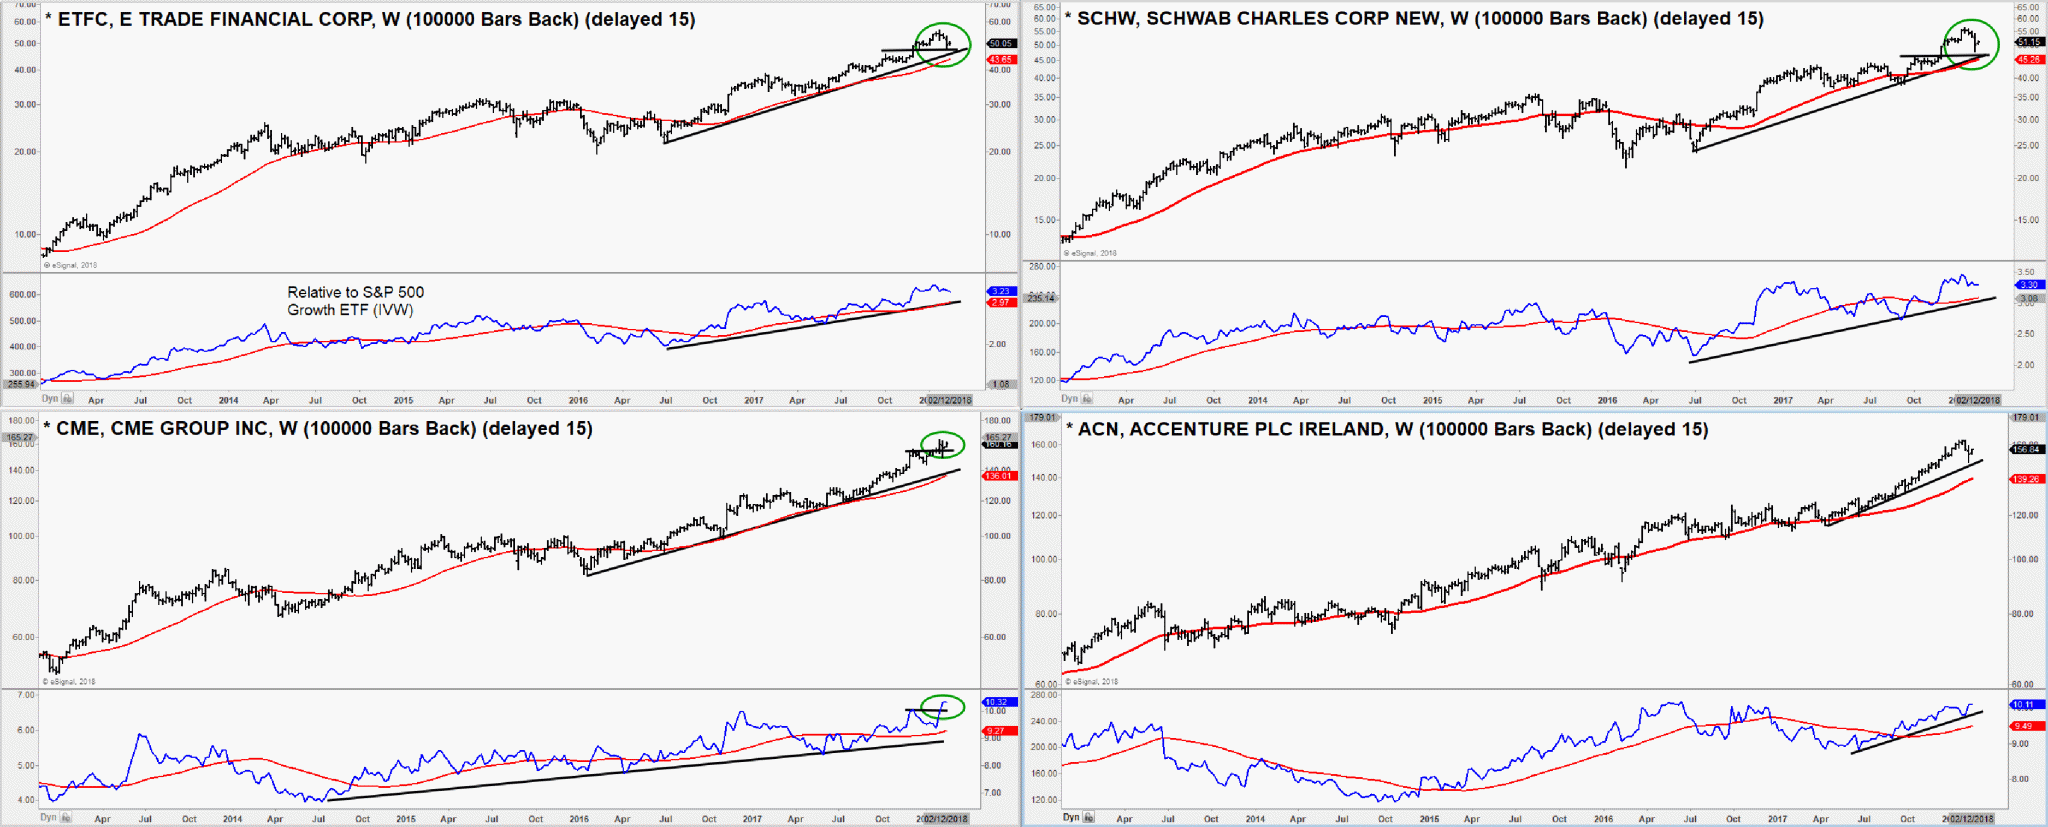
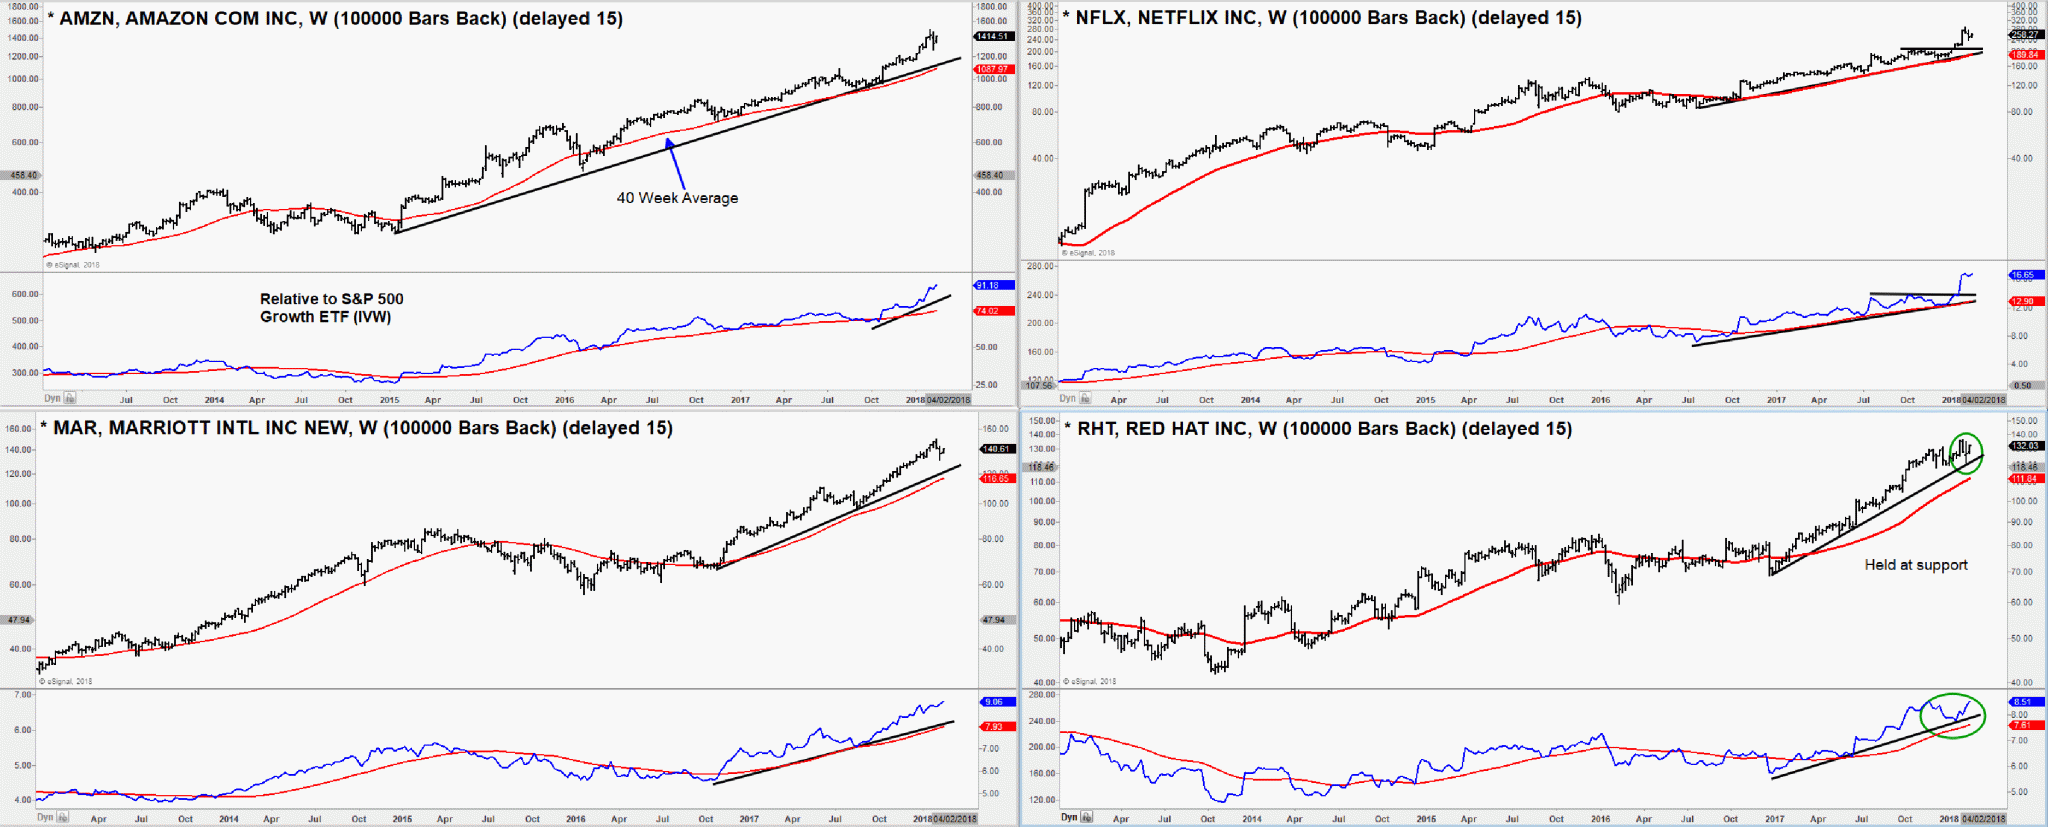
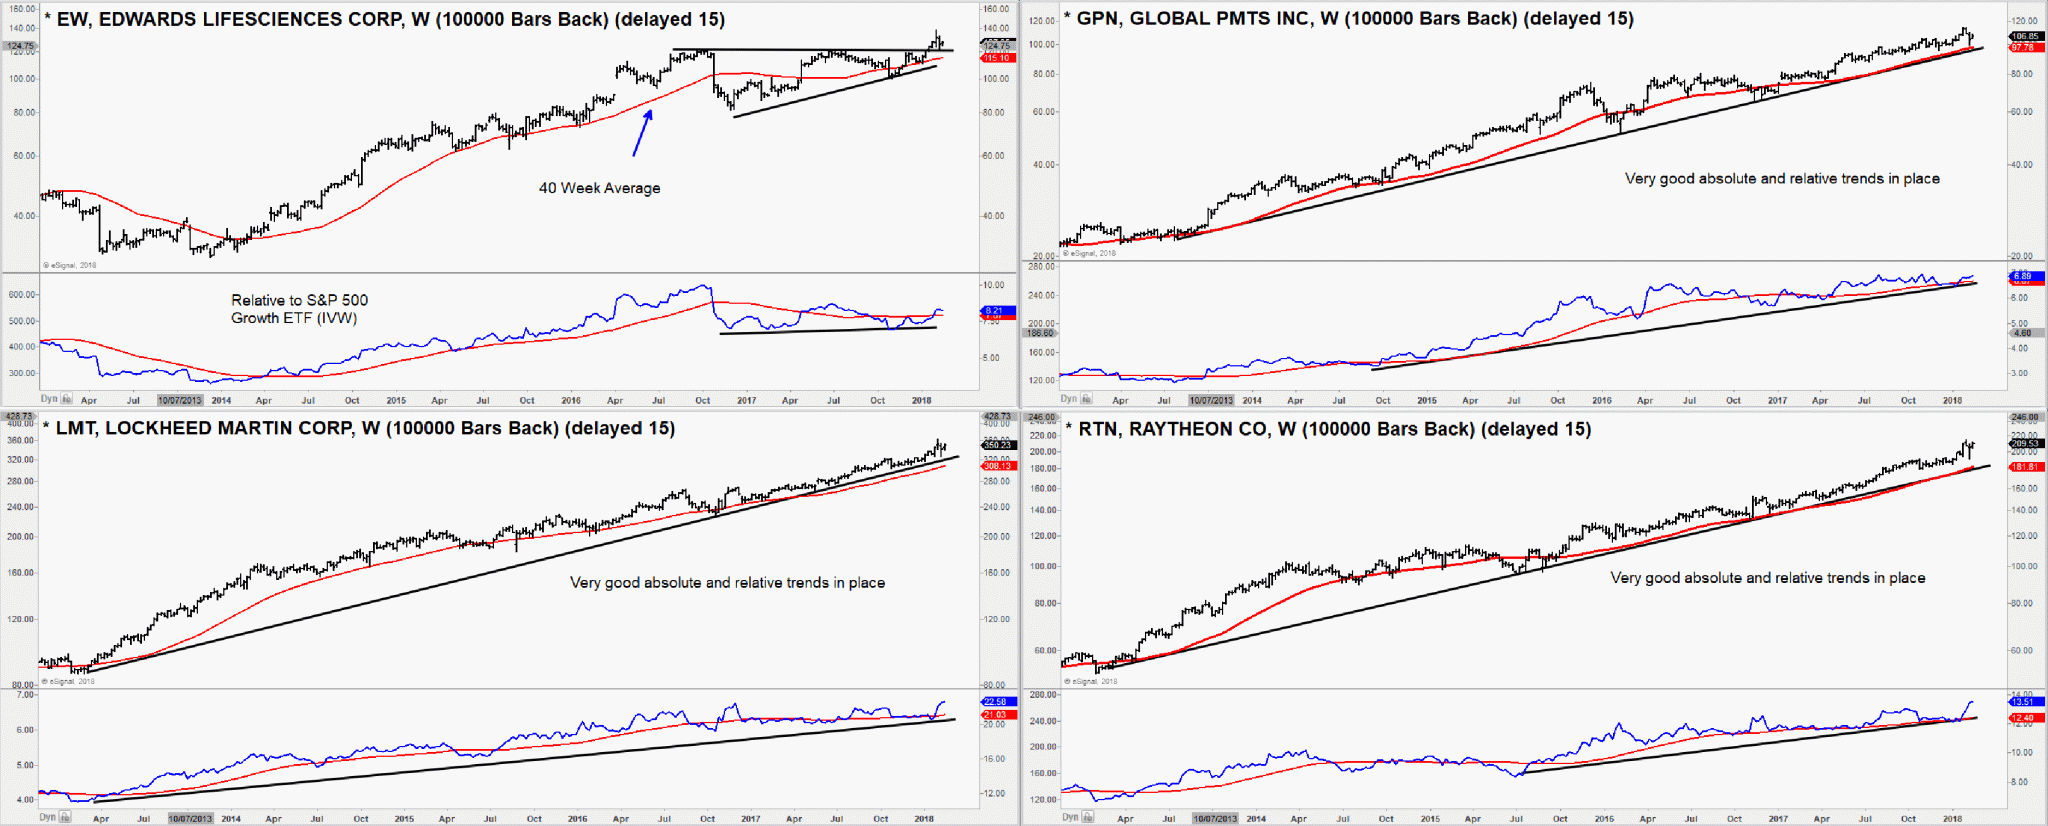
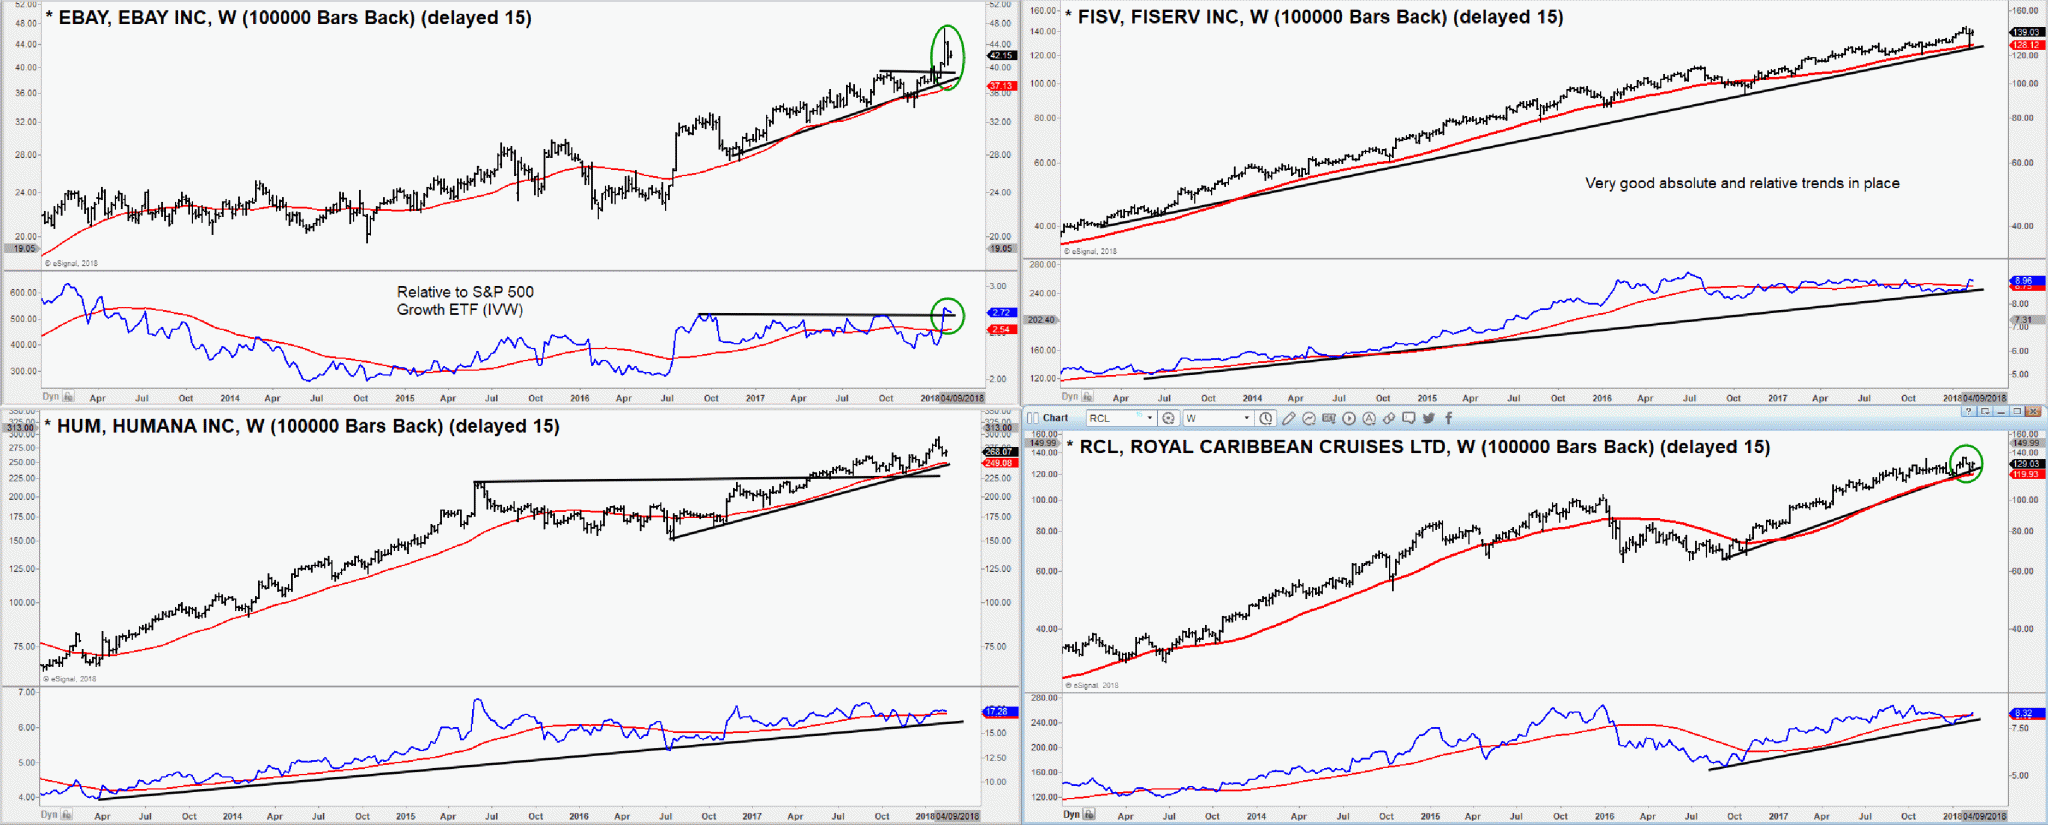
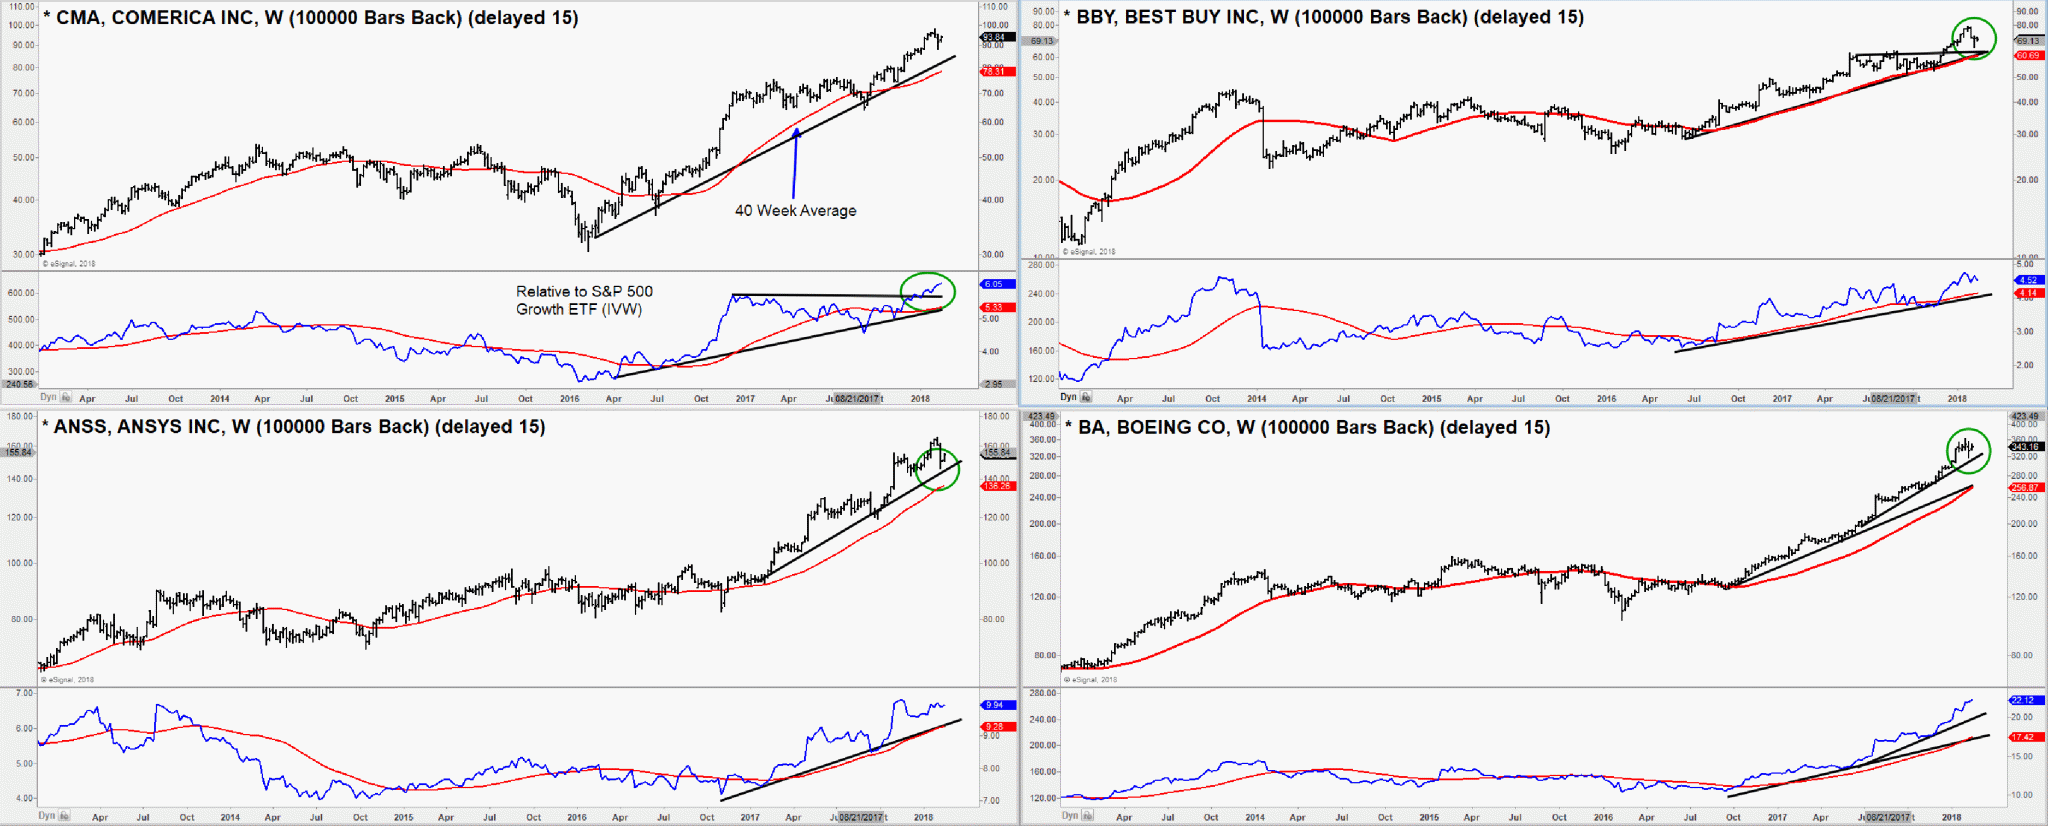
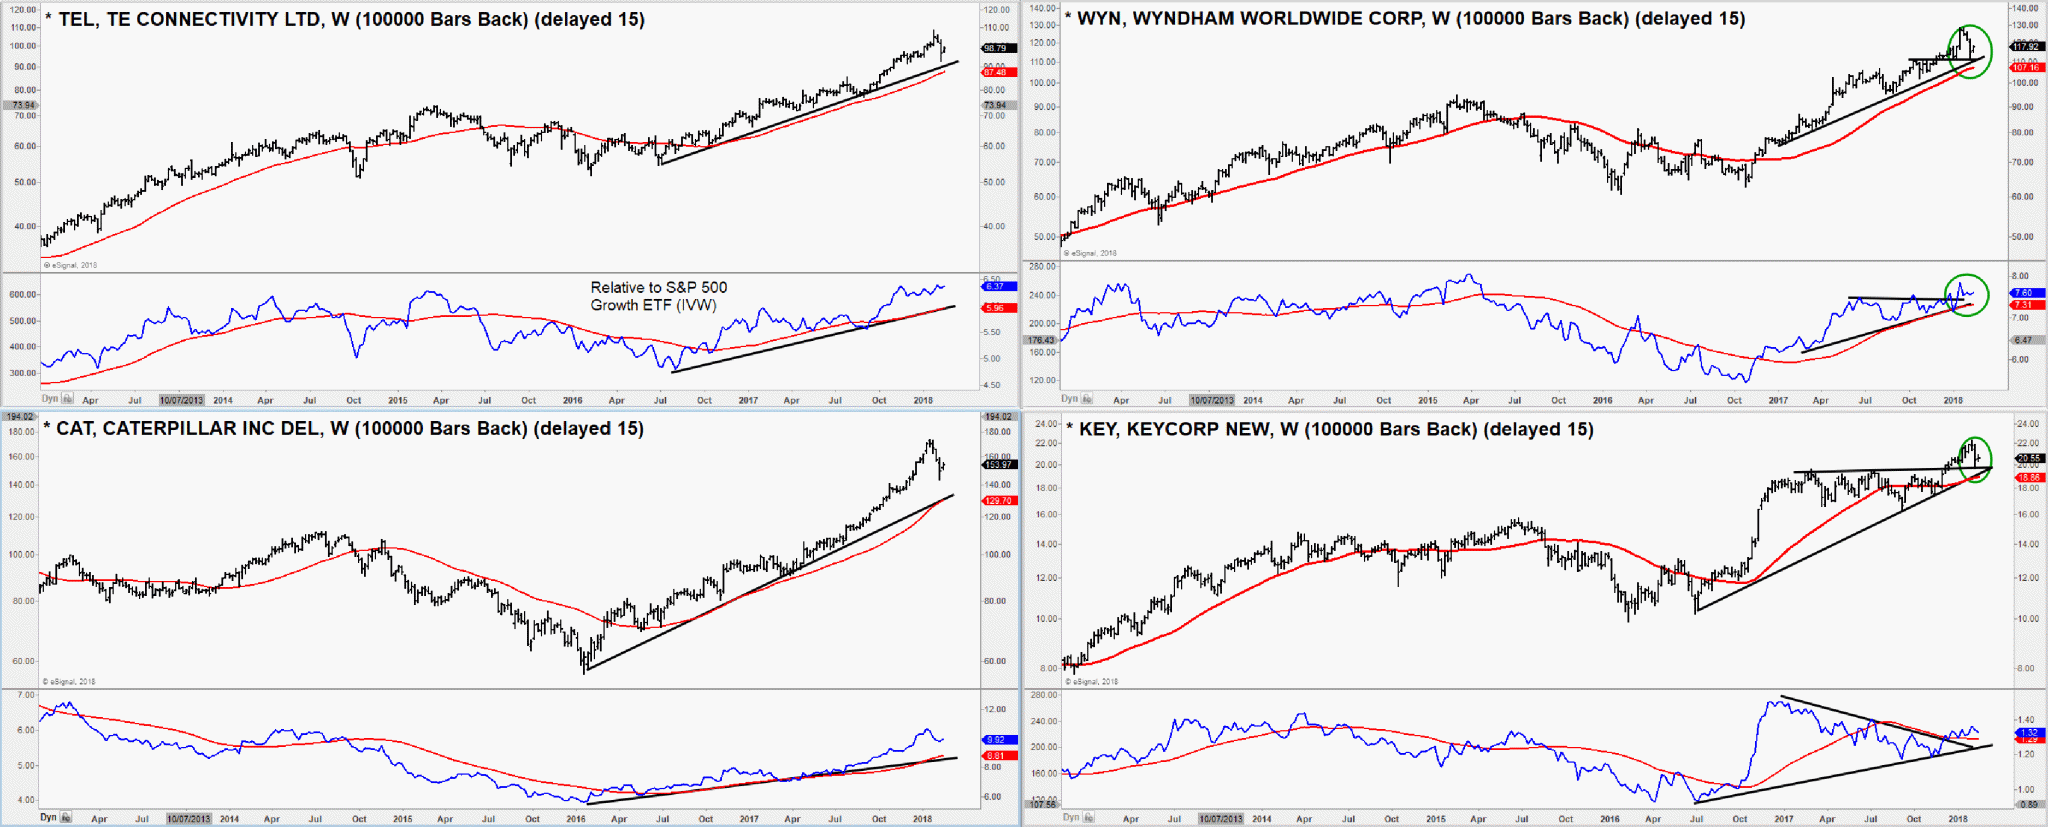
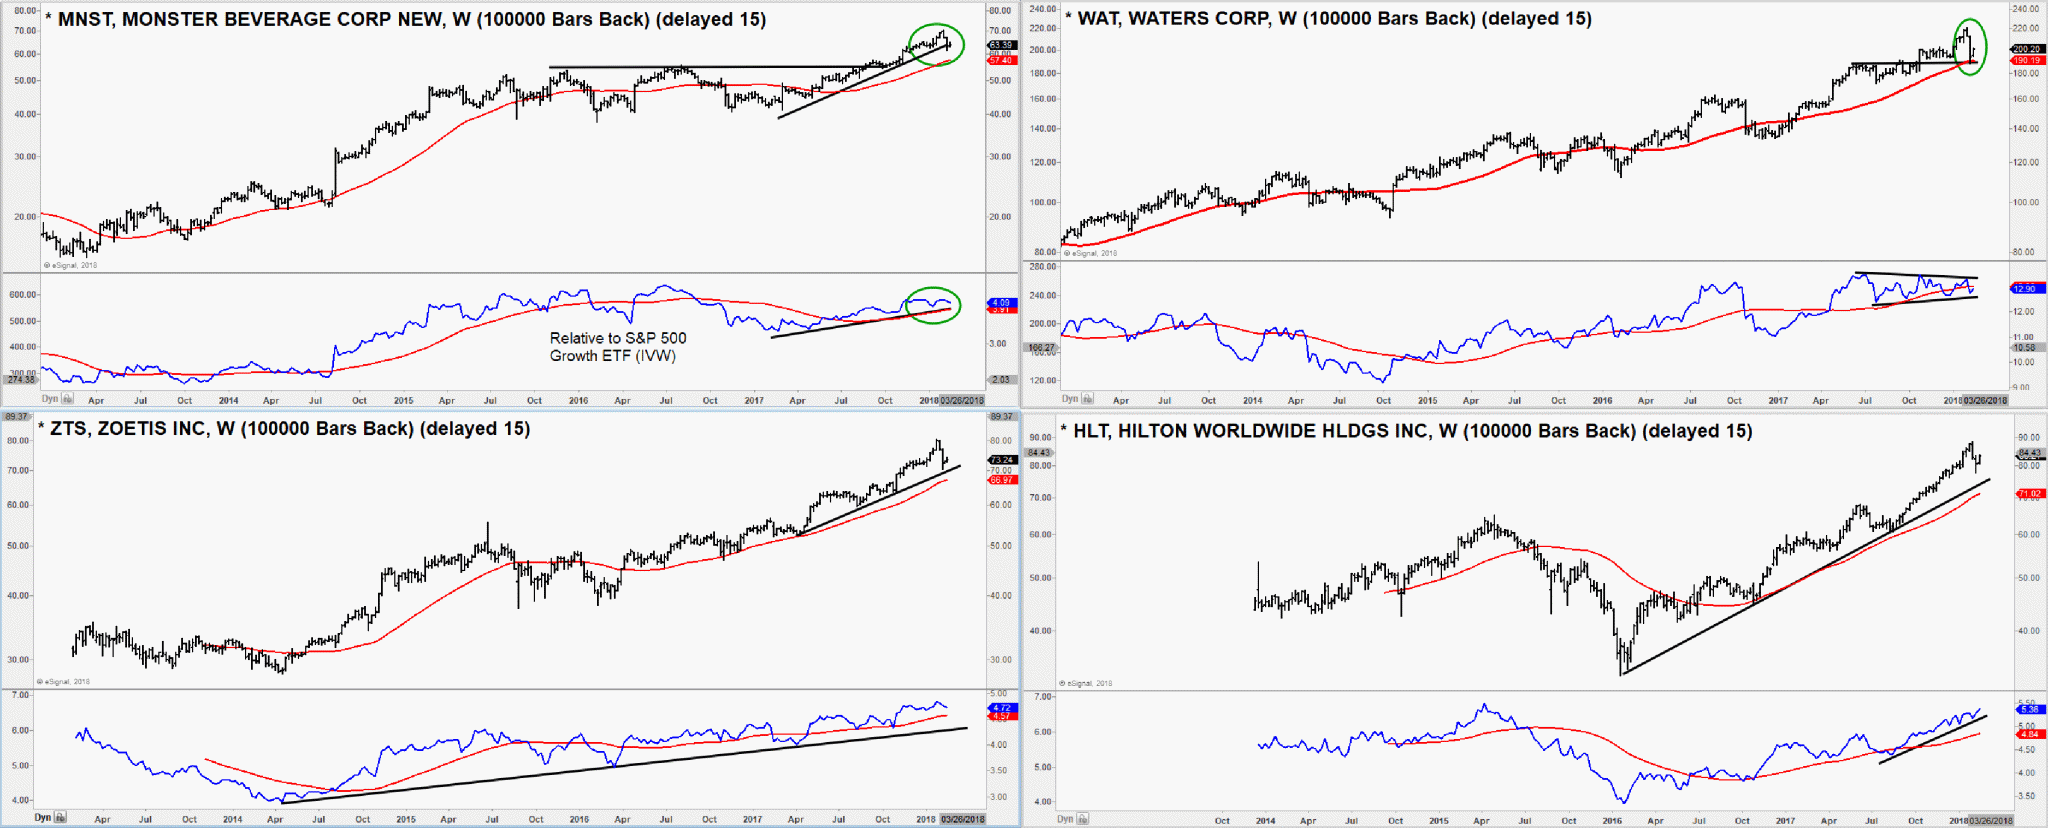
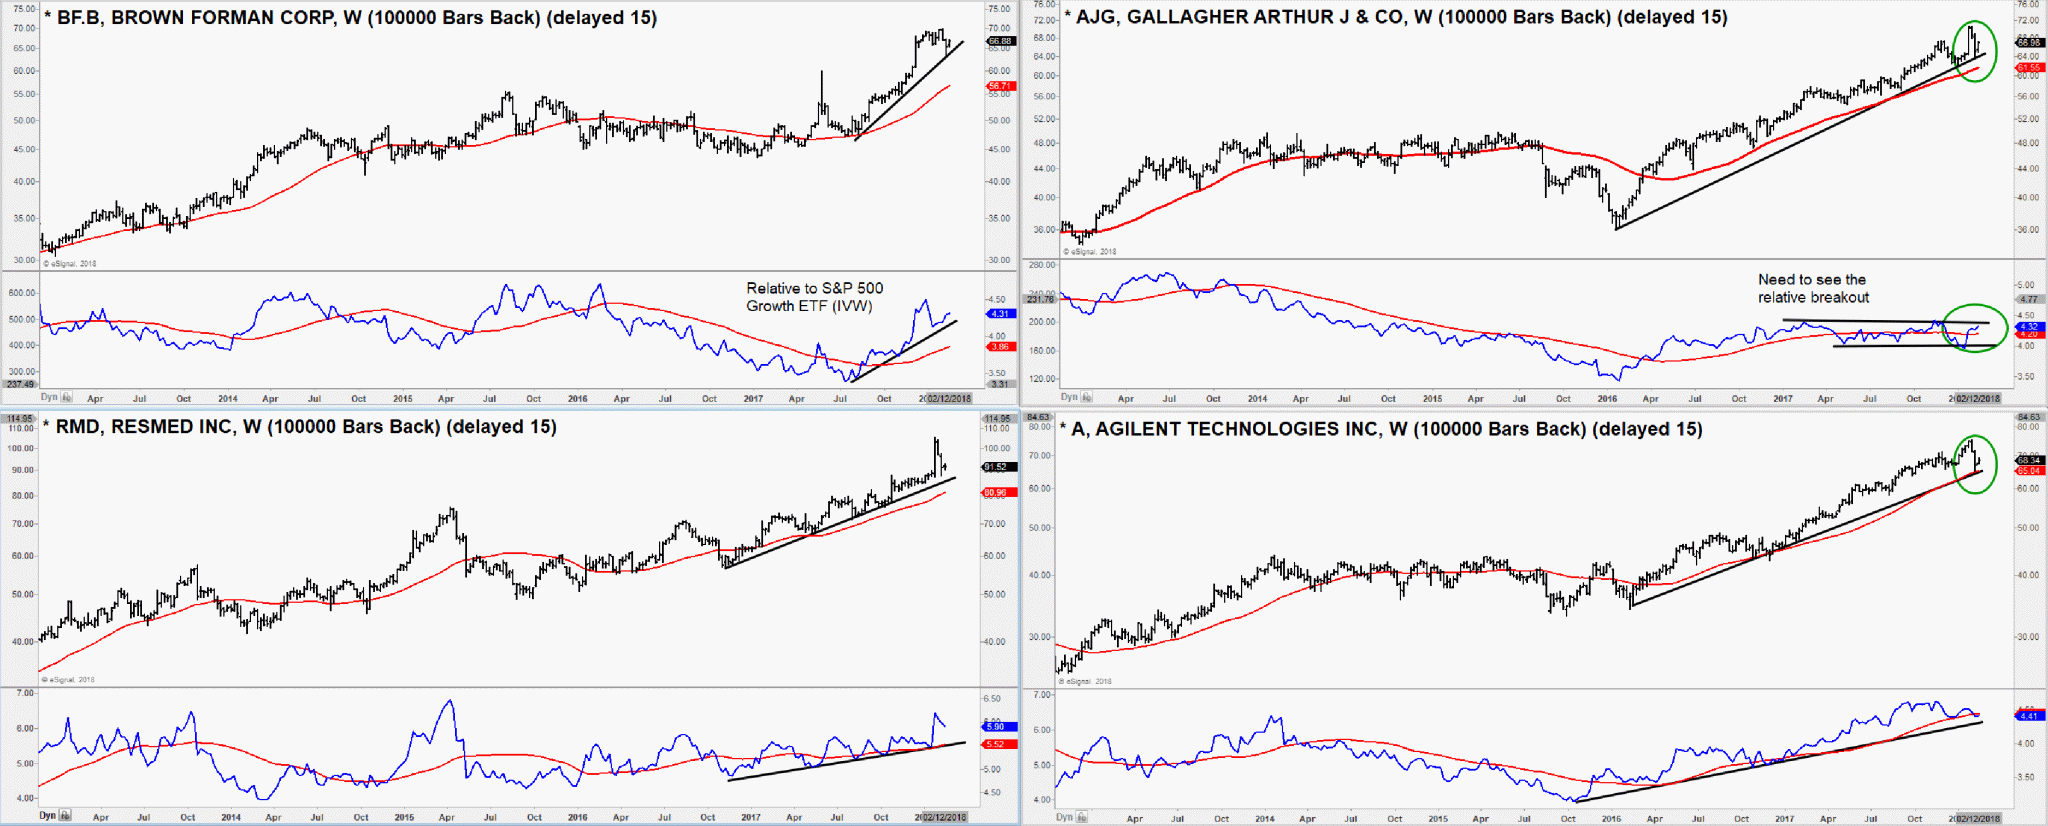
- In the following pages, we are highlighting 56 of the top scoring stocks in the IVW based on our multi-factor model. What you will see with ALL of these stocks is that we do NOT have multi-month distribute tops in place, but we do have stocks that needed to pullback from extended levels.
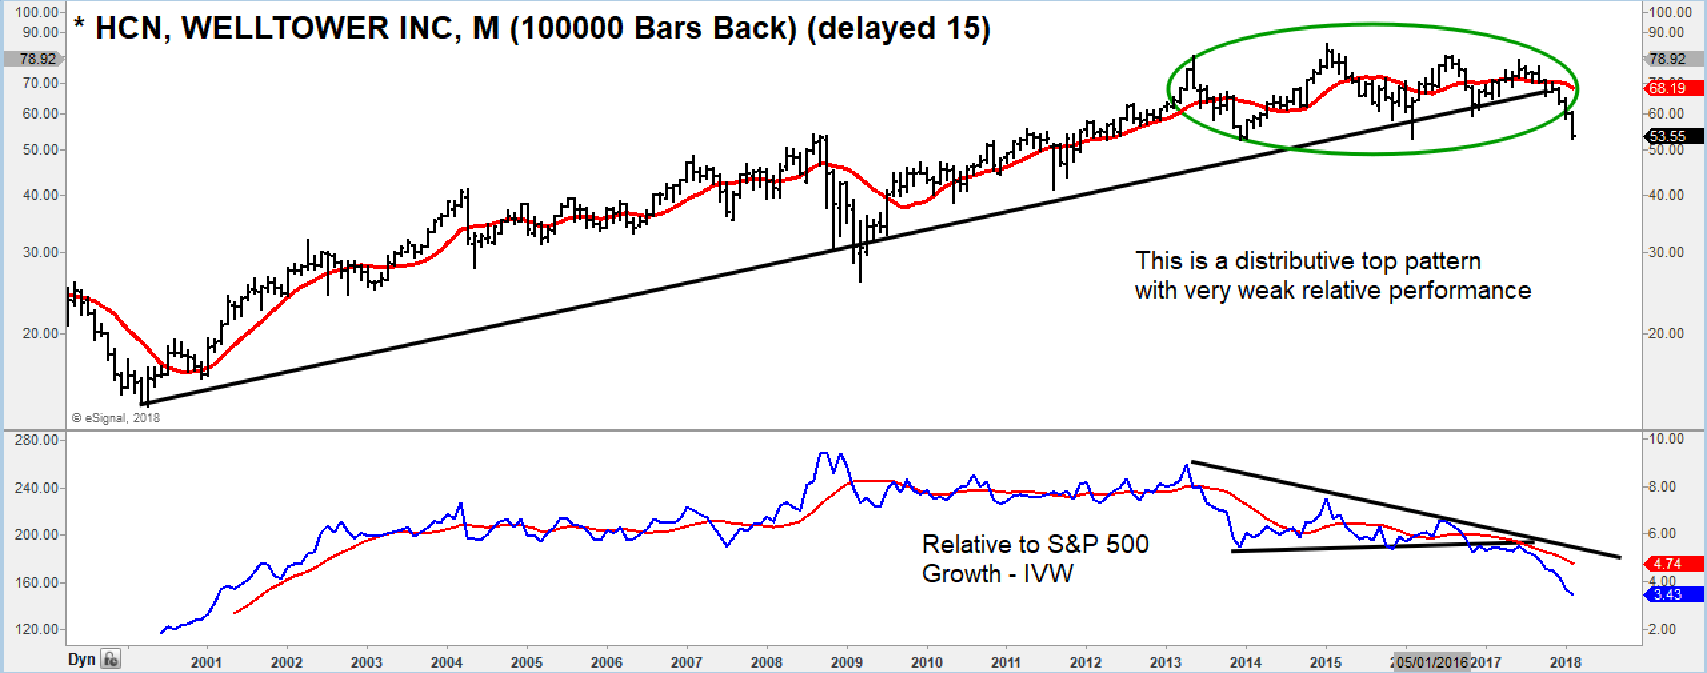
- The chart of HCN which has a distributive top in place and broke down from its topping pattern in December. This is an example of what we don’t have in the charts that follow.
- Below is a list of the stock charts in this report.
- The current chart if IVW highlights the retracement area after recent selloff.
| Symbol | Description | Industry | Symbol | Description | Industry | |
| ADOBE SYS INC | Software | EBAY INC | Internet Software & Services | |||
| V | VISA INC | IT Services | FISERV INC | IT Services | ||
| SPGI | S&P GLOBAL INC | Capital Markets | HUMANA INC | Health Care Providers & Services | ||
| MA | MASTERCARD | IT Services | ROYAL CARIBBEAN | Hotels, Restaurants & Leisure | ||
| ROPER TECHNOLOGIES | Industrial Conglomerates | COMERICA INC | Commercial Banks | |||
| TOTAL SYS SVCS INC | IT Services | BEST BUY INC | Specialty Retail | |||
| UNITEDHEALTH GROUP | Health Care Providers & Services | ANSYS INC | Software | |||
| MICROSOFT CORP | Software | BA | BOEING CO | Aerospace & Defense | ||
| SALESFORCE COM INC | Software | TEL | TE CONNECTIVITY LTD | Electronic Equipment & Instruments | ||
| MOODYS CORP | Capital Markets | WYN | WYNDHAM WORLDWIDE | Hotels, Restaurants & Leisure | ||
| NORTHROP GRUMMAN | Aerospace & Defense | CATERPILLAR INC DEL | Machinery | |||
| INTUIT | Software | KEYCORP NEW | Commercial Banks | |||
| HARRIS CORP DEL | Aerospace & Defense | SMITH A O | Building Products | |||
| L3 TECHNOLOGIES INC | Aerospace & Defense | NETAPP INC | Computers & Peripherals | |||
| NVIDIA CORP | Semiconductors & Semiconductor Equip. | INTUITIVE SURGICAL INC | Health Care Equipment & Supplies | |||
| XYL | XYLEM INC | Machinery | ALIGN TECHNOLOGY INC | Health Care Equipment & Supplies | ||
| ETFC | E TRADE FINANCIAL | Capital Markets | MONSTER BEVERAGE | Beverages | ||
| SCHW | SCHWAB CHARLES | Capital Markets | WATERS CORP | Life Sciences Tools & Services | ||
| CME GROUP INC | Capital Markets | ZTS | ZOETIS INC | Pharmaceuticals | ||
| ACCENTURE PLC IRELAND | IT Services | HILTON WORLDWIDE | Hotels, Restaurants & Leisure | |||
| AMAZON COM INC | Internet & Direct Marketing Retail | ACTIVISION BLIZZARD | Software | |||
| NETFLIX INC | Internet & Direct Marketing Retail | THERMO FISHER | Life Sciences Tools & Services | |||
| MARRIOTT INTL INC NEW | Hotels, Restaurants & Leisure | AETNA INC NEW | Health Care Providers & Services | |||
| RED HAT INC | Software | AVERY DENNISON | Containers & Packaging | |||
| EW | EDWARDS LIFESCIENCES | Health Care Equipment & Supplies | BF.B | BROWN FORMAN CORP | Beverages | |
| GLOBAL PMTS INC | IT Services | GALLAGHER ARTHUR | Insurance | |||
| LOCKHEED MARTIN CORP | Aerospace & Defense | RESMED INC | Health Care Equipment & Supplies | |||
| RAYTHEON CO | Aerospace & Defense | A | AGILENT TECHNOLOGIES | Life Sciences Tools & Services | ||
Blow is the chart we used in our January 16, 2018 report with the “Items of Interest” note:
- The S&P 500 Growth ETF is very extended from its long-term average, but we don’t have divergence as we had in 2015.
- Attached, we display 16 constituents that are very deviated from trend and should be considered as trims.
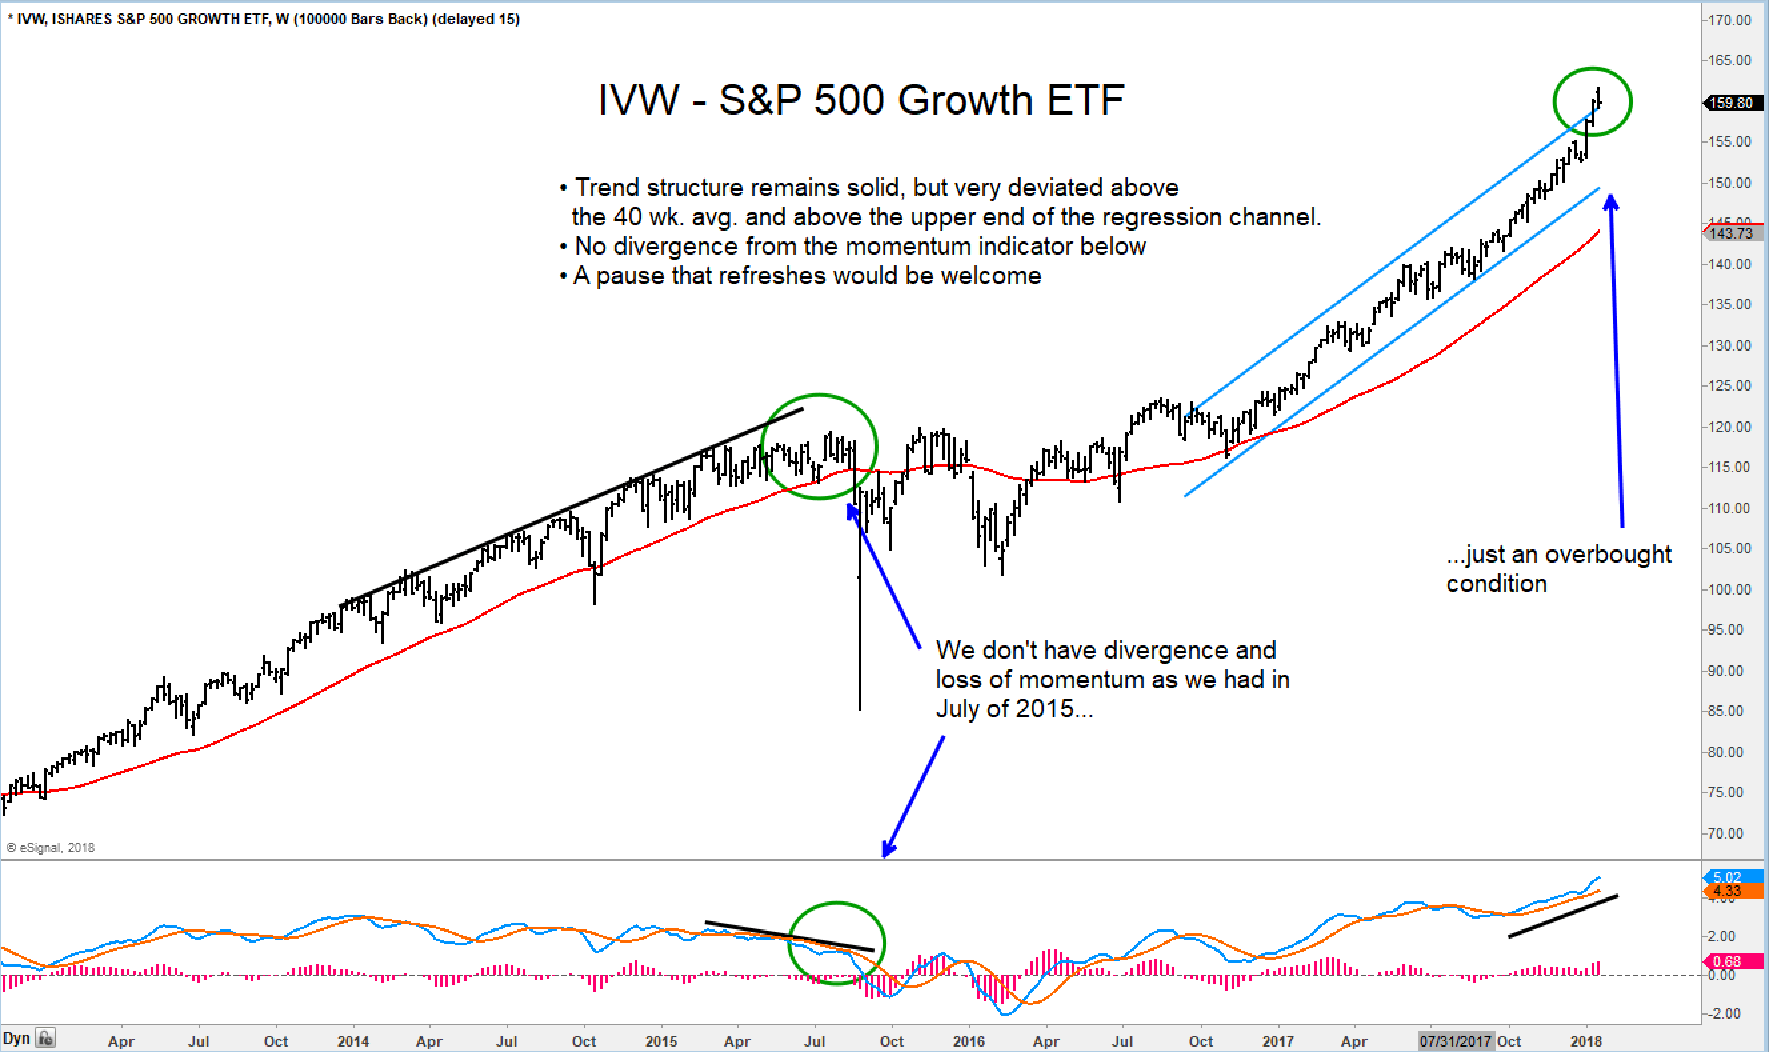
This is the current chart of the IVW
- We need to see signs of stalling as the IVW retraces sharply off the 40-week average
- A broader based buying opportunity will present itself as the index backs and fills from this short-term volatile move up
- For now, long only managers should stay focused on those stocks with firm absolute and relative uptrends in place and avoid names such as HCN.
- In the following pages we highlight a large basket of those names.


